Ideal pregnant basal body temperature chart. Basal temperature charts with examples and explanation

Measurement of basal temperature has become a truly popular means of pregnancy planning.
Why measure basal body temperature
Basal or rectal temperature (BT)- this is the body temperature at rest after at least 3-6 hours of sleep, the temperature is measured in the mouth, rectum or vagina. The temperature measured at this moment is practically not affected by environmental factors. Experience shows that many women perceive the doctor's requirements to measure basal temperature as a formality and basal temperature does not solve anything, but this is far from the case.
The method of measuring basal body temperature was developed in 1953 by the English professor Marshal and refers to research methods based on the biological effect of sex hormones, namely on the hyperthermic (temperature increase) action of progesterone on the thermoregulation center. The measurement of basal body temperature is one of the main tests for the functional diagnosis of ovarian function. Based on the results of measuring BT, a graph is built, an analysis of the graphs of basal temperature is given below.
Measurement of basal temperature and scheduling is recommended in gynecology in the following cases:
If you have been trying to get pregnant for a year without success
If you suspect infertility in yourself or your partner
If your gynecologist suspects you have hormonal disorders
In addition to the above cases, when basal body temperature charting is recommended by a gynecologist, you can measure basal body temperature if:
You want to increase your chances of pregnancy
You are experimenting with the method of planning the sex of the child
You want to observe your body and understand the processes taking place in it (this can help you in communicating with specialists)
Experience shows that many women perceive the doctor's requirements to measure basal temperature as a formality and it does not solve anything.
In fact, by measuring your basal body temperature, you and your doctor can find out:
Does the egg mature and when does it happen (respectively, highlight "dangerous" days for the purpose of protection, or vice versa, the possibility of getting pregnant);
Did ovulation occur after the maturation of the egg?
Determine the quality of your endocrine system
Suspect gynecological problems, such as endometritis
When to expect your next period
Whether pregnancy occurred in case of delayed or unusual menstruation;
Assess how correctly the ovaries secrete hormones in the phases of the menstrual cycle;
A graph of basal temperature, compiled according to all the rules of measurement, can show not only the presence of ovulation in the cycle or its absence, but also indicate diseases of the reproductive and endocrine systems. You must measure your basal temperature for at least 3 cycles so that the information accumulated during this time allows you to make accurate predictions about the expected date of ovulation and the most favorable time for conception, as well as conclusions about hormonal disorders. Only a specialist gynecologist can give an accurate assessment of your basal temperature chart. Charting a basal temperature chart can help a gynecologist determine deviations in the cycle and suggest the absence of ovulation, but at the same time, a diagnosis by a gynecologist only and exclusively based on the type of basal temperature chart without additional tests and examinations most often indicates medical unprofessionalism.
It is necessary to measure the basal temperature, and not the body temperature in the armpit. The general increase in temperature as a result of illness, overheating, physical exertion, eating, stress, naturally affects the basal temperature and makes them unreliable.
Thermometer for measuring basal temperature.
You will need a conventional medical thermometer: mercury or electronic. With a mercury thermometer, the basal temperature is measured for five minutes, while the electronic thermometer must be removed after the signal about the end of the measurement. After he squeaked, the temperature will still rise for a while, because the thermometer fixes the moment when the temperature rises above it very slowly (and do not listen to nonsense about the fact that the thermometer is in bad contact with the muscles of the anus). The thermometer must be prepared in advance, in the evening, by placing it next to the bed. Don't put mercury thermometers under your pillow!
Rules for measuring basal temperature.
It is necessary to measure the basal temperature, if possible, every day, including on the days of menstruation.
You can measure in the mouth, in the vagina or in the rectum. The main thing is that throughout the entire cycle the place of measurement does not change. Armpit temperature measurement is not accurate. With the oral method of measuring basal temperature, you put a thermometer under your tongue and, with your mouth closed, measure for 5 minutes.
For vaginal or rectal measurements, insert the narrow part of the thermometer into the anus or vagina, measuring for 3 minutes. Measurement of temperature in the rectum is the most common.
Take your basal body temperature in the morning, right after waking up and before getting out of bed.
It is necessary to measure the basal temperature at the same time (a difference of half an hour - an hour (maximum one and a half hours) is acceptable). If you decide to sleep in longer on the weekend, make a note of this on your schedule. Keep in mind that every extra hour of sleep raises your basal temperature by about 0.1 degrees.
Uninterrupted sleep before measuring basal temperature in the morning should last at least three hours. Therefore, if you measure the temperature at 8 am, but got up at 7 am to go, for example, to the toilet, it is better to measure BT before that, otherwise, at 8 o'clock familiar to you, it will no longer be informative.
You can use both digital and mercury thermometers to measure. It is important not to change the thermometer during one cycle.
If you use a mercury thermometer, shake it off before you go to sleep. The effort you make to shake off the thermometer just before taking your basal temperature can affect your temperature.
Basal body temperature is measured in the supine position. Do not make unnecessary movements, do not turn around, activity should be minimal. Never get up to take a thermometer! Therefore, it is better to cook it in the evening and put it near the bed in order to be able to reach the thermometer with your hand. Some experts advise taking measurements without even opening your eyes, as daylight can increase the release of certain hormones.
Readings from the thermometer are taken immediately after it is removed.
Basal temperature after measurement is best recorded immediately. Otherwise, you will forget or get confused. Basal temperature every day is approximately the same, differs by tenths of degrees. Relying on your memory, you can get confused in the testimony. If the thermometer readings are between two numbers, record the lower reading.
The graph must indicate the reasons that could lead to an increase in basal temperature (ARI, inflammatory diseases, etc.).
Business trips, moving and flights, sexual intercourse the night before or in the morning can significantly affect the basal temperature.
In diseases accompanied by elevated body temperature, your basal temperature will be uninformative and you can stop measuring for the duration of the illness.
Various medications, such as sleeping pills, sedatives, and hormonal medications, can affect basal body temperature.
Measurement of basal temperature and the simultaneous use of oral (hormonal) contraceptives does not make any sense. The basal temperature depends on the concentration of hormones in the tablets.
After taking a large amount of alcohol, the basal temperature will be uninformative.
When working at night, basal temperature is measured during the day after at least 3-4 hours of sleep.
The basal body temperature (BT) record table should contain the lines:
Day of the month
cycle day
BT
Notes: Abundant or moderate discharge, abnormalities that can affect BBT: general illness, including fever, diarrhea, intercourse in the evening (especially in the morning), drinking alcohol the day before, measuring BBT at an unusual time, going to bed late (for example, went to bed at 3 o'clock, and measured at 6), taking sleeping pills, stress, etc.
The "Notes" column contains all the factors that in one way or another could affect the change in basal temperature.
This form of recording helps both the woman and her doctor to understand the possible causes of infertility, cycle disorders, etc.
Rationale for the basal body temperature method
Basal body temperature during the cycle changes under the influence of hormones.
During the maturation of the egg against the background of a high level of estrogens (the first phase of the menstrual cycle, hypothermic, "low"), the basal temperature is low, on the eve of ovulation it drops to its minimum, and then rises again, reaching a maximum. At this time, ovulation takes place. After ovulation, the high temperature phase begins (the second phase of the menstrual cycle, hyperthermic, "high"), which is caused by low levels of estrogen and high levels of progesterone. Pregnancy under the influence of progesterone also takes place completely in the high temperature phase. The difference between the "low" (hypothermic) and "high" (hyperthermal) phases is 0.4-0.8 °C. Only with accurate measurement of basal body temperature, it is possible to fix the level of "low" temperature in the first half of the menstrual cycle, the transition from "low" to "high" on the day of ovulation, and the temperature level in the second phase of the cycle.
Usually during menstruation, the temperature is kept at 37 ° C. During the maturation of the follicle (the first phase of the cycle), the temperature does not exceed 37°C. Before ovulation itself, it decreases (the result of the action of estrogen), and after it, the basal temperature rises to 37.1 ° C and above (the effect of progesterone). Until the next menstruation, the basal temperature remains elevated and slightly decreases by the first day of menstruation. If the basal temperature in the first phase, relative to the second, is high, then this may indicate a small amount of estrogen in the body and requires correction with drugs containing female sex hormones. On the contrary, if in the second phase, relative to the first, a low basal temperature is observed, then this is an indicator of a low level of progesterone, and drugs are also prescribed here to correct the hormonal background. This should be done only after passing the appropriate tests for hormones and prescribing a doctor.
A persistent two-phase cycle indicates ovulation, which has taken place and the presence of a functionally active corpus luteum (the correct rhythm of the ovaries).
The absence of a rise in temperature in the second phase of the cycle (monotonous curve) or significant temperature fluctuations, both in the first and second half of the cycle with the absence of a stable rise, indicates inoculation (lack of release of the egg from the ovaries).
The delay in the rise and its short duration (hypothermic phase for 2-7, up to 10 days) is observed with a shortening of the luteal phase, insufficient rise (0.2-0.3 ° C) - with insufficient functioning of the corpus luteum.
The thermogenic effect of progesterone leads to an increase in body temperature by at least 0.33 ° C (the effect lasts until the end of the luteal, that is, the second, phase of the menstrual cycle). Progesterone levels peak 8 to 9 days after ovulation, which is approximately the time a fertilized egg implants in the uterine wall.
By making a chart of basal temperature, you can not only determine when you ovulate, but also find out what processes are taking place in your body.
Decoding charts of basal temperature. Examples
If the basal temperature chart is built correctly, taking into account the measurement rules, it can reveal not only the presence or absence of ovulation, but also some diseases.

Break line
The line is drawn over 6 temperature values in the first phase of the cycle, preceding ovulation.
This does not take into account the first 5 days of the cycle, as well as days on which various negative factors could affect the temperature (see temperature measurement rules). This line does not allow any conclusions to be drawn from the graph and is for illustration purposes only.
ovulation line
In order to judge the onset of ovulation, the rules established by the World Health Organization (WHO) are used:
Three temperature values in a row must be above the level of the line drawn over the previous 6 temperature values.
The difference between the midline and the three temperatures must be at least 0.1 degrees on two of the three days and at least 0.2 degrees on one of those days.
If your temperature curve meets these requirements, then an ovulation line will appear on your basal temperature chart 1-2 days after ovulation.
Sometimes it is not possible to determine ovulation according to the WHO method due to the fact that there are high temperatures in the first phase of the cycle. In this case, you can apply the “finger rule” to the basal temperature chart. This rule excludes temperature values that differ from the previous or next temperature by more than 0.2 degrees. Such temperatures should not be taken into account when calculating ovulation, if in general the basal temperature chart is normal.
The most optimal time for conception is the day of ovulation and 2 days before it.
Menstrual cycle length
The total cycle length should normally not be shorter than 21 days and should not exceed 35 days. If your cycles are shorter or longer, then you may have ovarian dysfunction, which is often the cause of infertility and needs to be treated by a gynecologist.
Second phase length
The basal temperature graph is divided into the first and second phases. The separation takes place where the ovulation line (vertical) is affixed. Accordingly, the first phase of the cycle is the segment of the graph before ovulation, and the second phase of the cycle after ovulation.
The length of the second phase of the cycle is normally from 12 to 16 days, most often 14 days. In contrast, the length of the first phase can vary greatly, and these variations are an individual norm. At the same time, in a healthy woman in different cycles, there should not be significant differences in the length of the first phase and the second phase. The total length of the cycle normally changes only due to the length of the first phase.
One of the problems revealed on the graphs and confirmed by subsequent hormonal studies is the insufficiency of the second phase. If you have been measuring your basal temperature for several cycles, following all the measurement rules, and your second phase is shorter than 10 days, this is a reason to consult a gynecologist. Also, if you regularly have sexual intercourse during ovulation, pregnancy does not occur and the length of the second phase is at the lower limit (10 or 11 days), then this may indicate a lack of the second phase.
temperature difference
Normally, the difference in the average temperatures of the first and second phases should be more than 0.4 degrees. If it is lower, then this may indicate hormonal problems. Take a blood test for progesterone and estrogen and consult a gynecologist.
An increase in basal temperature occurs when the level of progesterone in the blood serum exceeds 2.5-4.0 ng / ml (7.6-12.7 nmol / l). However, monophasic basal temperature has been identified in a number of patients with normal progesterone levels in the second phase of the cycle. In addition, monophasic basal temperature is noted at approximately 20% of ovulatory cycles. A simple statement of a two-phase basal temperature does not prove the normal function of the corpus luteum either. Basal temperature also cannot be used to determine the time of ovulation, since a two-phase basal temperature is also observed during luteinization of a non-ovulated follicle. Nevertheless, the duration of the luteal phase in accordance with the data of basal temperature and the low rate of rise in basal temperature after ovulation are accepted by many authors as criteria for diagnosing the syndrome of luteinization of a non-ovulating follicle.
Five main types of temperature curves are described in classic gynecological manuals.
On such graphs, there is an increase in temperature in the second phase of the cycle by at least 0.4 C; noticeable "preovulatory" and "premenstrual" temperature drop. The duration of the temperature increase after ovulation is 12-14 days. Such a curve is typical of a normal biphasic menstrual cycle.

The graph example shows a pre-ovulatory drop on the 12th day of the cycle (the temperature drops significantly two days before ovulation), as well as a premenstrual drop starting from the 26th day of the cycle.
There is a weakly pronounced rise in temperature in the second phase. The temperature difference in the first and second phases is no more than 0.2-0.3 C. Such a curve may indicate estrogen-progesterone deficiency. See chart examples below.
If such schedules are repeated from cycle to cycle, then this may indicate hormonal disruptions that cause infertility.
Basal temperature begins to rise only shortly before menstruation, while there is no "premenstrual" temperature drop. The second phase of the cycle may last less than 10 days. Such a curve is typical for a two-phase menstrual cycle with insufficiency of the second phase. See chart examples below.
Pregnancy in such a cycle is possible, but it is at risk from the very beginning. At this point, a woman still cannot know about the onset of pregnancy, even gynecologists would find it difficult to make a diagnosis at such an early date. With such a schedule, we can talk not about infertility, but about miscarriage. Be sure to contact your gynecologist if you have such a schedule for 3 cycles.
In a cycle without ovulation, the corpus luteum is not formed, which produces the hormone progesterone and affects the increase in basal body temperature. In this case, the temperature rise is not visible on the basal temperature chart and ovulation is not detected. If there is no ovulation line on the chart, in this case we are talking about an anovulatory cycle.
Each woman can have several anovulatory cycles a year - this is normal and does not require medical intervention, but if this situation repeats from cycle to cycle, be sure to consult a gynecologist. Without ovulation - pregnancy is impossible!
A monotonic curve occurs when there is no pronounced rise throughout the cycle. Such a schedule is observed during an anovulatory (ovulation is absent) cycle. See chart examples below.

On average, a woman has one anovulatory cycle per year and there is no cause for concern in this case. But anovulatory schedules that are repeated from cycle to cycle are a very serious reason to contact a gynecologist. Without ovulation, a woman cannot become pregnant and we are talking about female infertility.
estrogen deficiency
Chaotic temperature curve. The graph shows large temperature swings, it does not fit into any of the above types. This type of curve can be observed both in severe estrogen deficiency and depend on random factors. Chart examples below.
A competent gynecologist will definitely require testing for hormones and conduct an ultrasound examination before prescribing medications.
High basal temperature in the first phase
The basal temperature graph is divided into the first and second phases. The separation takes place where the ovulation line (vertical line) is affixed. Accordingly, the first phase of the cycle is the segment of the graph before ovulation, and the second phase of the cycle after ovulation.
Estrogen deficiency
In the first phase of the cycle in the female body, the hormone estrogen dominates. Under the influence of this hormone, the basal temperature before ovulation is kept on average in the range from 36.2 to 36.5 degrees. If the temperature in the first phase rises and stays above this mark, then estrogen deficiency can be assumed. In this case, the average temperature of the first phase rises to 36.5 - 36.8 degrees and is kept at this level. To increase the level of estrogen, gynecologists-endocrinologists will prescribe hormonal drugs.
Estrogen deficiency also leads to an increased temperature in the second phase of the cycle (above 37.1 degrees), while the rise in temperature is slow and takes more than 3 days.

On the example of the graph, the temperature in the first phase is above 37.0 degrees, in the second phase it rises to 37.5, the rise in temperature by 0.2 degrees on the 17th and 18th day of the cycle is insignificant. Fertilization in a cycle with such a schedule is very problematic.
Inflammation of the appendages
Another reason for an increase in temperature in the first phase may be inflammation of the appendages. In this case, the temperature rises only for a few days in the first phase to 37 degrees, and then drops again. In such charts, ovulation calculation is difficult because such a rise "masks" the ovulatory rise.

On the example of the graph, the temperature in the first phase of the cycle is kept at 37.0 degrees, the increase occurs sharply and also falls sharply. A rise in temperature on day 6 of the cycle can be mistaken for an ovulatory rise, but in fact it most likely indicates inflammation. Therefore, it is so important to measure the temperature throughout the cycle in order to exclude such a scenario: the temperature rose due to inflammation, then fell again and then rose due to the onset of ovulation.
endometritis
Normally, the temperature in the first phase should decrease during menstrual bleeding. If your temperature at the end of the cycle drops before the onset of menstruation and rises again to 37.0 degrees with the onset of menstruation (less often on day 2-3 of the cycle), then this may indicate the presence of endometritis.


Characteristically, the temperature drops before menstruation and rises with the beginning of the next cycle. If there is no drop in temperature before the start of menstruation in the first cycle, i.e., the temperature is kept at this level, then pregnancy can be assumed, despite the onset of bleeding. Take a pregnancy test and consult a gynecologist who will conduct an ultrasound for an accurate diagnosis.
If the basal temperature in the first phase rises sharply for one day, then this does not mean anything. Inflammation of the appendages cannot begin and end in one day. Also, a lack of estrogen can only be assumed by evaluating the entire graph, and not a separate temperature in the first phase. In diseases accompanied by high or elevated body temperature, it makes no sense to measure basal temperature, and even more so to judge its nature and analyze the graph.
Low temperature in the second phase of the menstrual cycle
In the second phase of the cycle, the basal temperature should differ significantly (by about 0.4 degrees) from the first phase and be at the level of 37.0 degrees or higher if you measure the temperature rectally. If the temperature difference is less than 0.4 degrees and the average temperature of the second phase does not reach 36.8 degrees, then this may indicate problems.
Insufficiency of the corpus luteum
In the second phase of the cycle, the female body begins to produce the hormone progesterone or the corpus luteum hormone. This hormone is responsible for raising the temperature in the second phase of the cycle and prevents the onset of menstruation. If this hormone is not enough, then the temperature rises slowly and the onset of pregnancy may be at risk.
The temperature in case of corpus luteum insufficiency rises shortly before menstruation, and there is no "premenstrual" fall. This may indicate hormonal deficiency. The diagnosis is based on a blood test for progesterone in the second phase of the cycle. If its values are lowered, then usually the gynecologist prescribes a progesterone substitute: utrogestan or duphaston. These drugs are taken strictly after the onset of ovulation. With the onset of pregnancy, the reception continues until 10-12 weeks. Abrupt withdrawal of progesterone in the second phase during pregnancy can lead to the threat of termination of pregnancy.

Particular attention should be paid to charts with a short second phase. If the second phase is shorter than 10 days, then one can also judge the insufficiency of the second phase.
Situations when the basal temperature remains elevated for more than 14 days occur during pregnancy, the formation of an ovarian corpus luteum cyst, and also in an acute inflammatory process of the pelvic organs.
Estrogen-progesterone deficiency
If, in combination with a low temperature in the second phase, your graph shows a slight rise in temperature (0.2-0.3 C) after ovulation, then such a curve may indicate not only a lack of progesterone, but also a lack of the hormone estrogen.

Hyperprolactinemia
Due to the increase in the level of the pituitary hormone - prolactin, which is responsible for maintaining pregnancy and lactation, the basal temperature graph in this case may resemble the graph of a pregnant woman. Menstruation, as well as during pregnancy, may be absent. An example of a basal temperature chart for hyperprolactinemia

Basal temperature chart for ovulation stimulation
When ovulation is stimulated, in particular with clomiphene (clostilbegyt) using duphaston in the second phase of the mc, the basal temperature graph, as a rule, becomes "normal" - two-phase, with a pronounced phase transition, with a fairly high temperature in the second phase, with characteristic "steps" (the temperature rises 2 times) and a slight sinking. If the temperature schedule during stimulation, on the contrary, is violated and deviates from the normal, this may indicate an incorrect selection of the dose of drugs or an inappropriate stimulation scenario (other medications may be needed). An increase in temperature in the first phase during stimulation with clomiphene also occurs with individual sensitivity to the drug.
Special cases of the basal temperature chart
Low or high temperature in both phases, provided that the temperature difference is at least 0.4 degrees, is not a pathology. This is an individual feature of the body. The measurement method can also affect the temperature values. Typically, with an oral measurement, the basal temperature is 0.2 degrees lower than with a rectal or vaginal measurement.
When to contact a gynecologist?
If you strictly observe the rules for measuring temperature and observe the described problems on your basal temperature graph for at least 2 cycles in a row, contact your doctor for additional examinations. Beware of making diagnoses by a gynecologist only on the basis of charts. What you need to pay attention to:
anovulatory charts
regular cycle delays in case of non-approaching pregnancy
late ovulation and not getting pregnant for several cycles
controversial schedules with indistinct ovulation
high temperature charts throughout the cycle
low temperature curves throughout the cycle
schedules with a short (less than 10 days) second phase
charts with high temperature in the second phase of the cycle for more than 18 days, without the onset of menstruation and a negative pregnancy test
unexplained bleeding or heavy discharge mid-cycle
heavy menstruation lasting more than 5 days
graphs with a temperature difference in the first and second phases of less than 0.4 degrees
cycles shorter than 21 days or longer than 35 days
graphs with well-defined ovulation, regular intercourse during ovulation and no pregnancy for several cycles
Signs of probable infertility according to the basal temperature chart:
The average value of the second phase of the cycle (after the temperature rise) exceeds the average value of the first phase by less than 0.4°C.
In the second phase of the cycle, there are drops in temperature (the temperature drops below 37°C).
The rise in temperature in the middle of the cycle lasts more than 3-4 days.
The second phase is short (less than 8 days).
Definition of pregnancy by basal temperature
The method of determining pregnancy by basal temperature works subject to the presence of ovulation in the cycle, since with some health disorders, the basal temperature can be increased for an arbitrarily long time, and menstruation may be absent. A striking example of such a violation is hyperprolactinemia, due to increased production of the hormone prolactin by the pituitary gland. Prolactin is responsible for maintaining pregnancy and lactation and is normally elevated only during pregnancy and lactation (see Examples of graphs for normal and various disorders).
Fluctuations in basal temperature in different phases of the menstrual cycle are due to different levels of hormones responsible for phases 1 and 2.
During menstruation, the basal temperature is always elevated (about 37.0 and above). In the first phase of the cycle (follicular) before ovulation, the basal temperature is low, up to 37.0 degrees.
Before ovulation, the basal temperature decreases, and immediately after ovulation it rises by 0.4 - 0.5 degrees and remains elevated until the next menstruation.
In women with different lengths of the menstrual cycle, the duration of the follicular phase is different, and the length of the luteal (second) phase of the cycle is approximately the same and does not exceed 12-14 days. Thus, if the basal temperature after the jump (which indicates ovulation) remains elevated for more than 14 days, this clearly indicates the onset of pregnancy.
This method of determining pregnancy works subject to the presence of ovulation in the cycle, since with some health disorders, the basal temperature can be increased for an arbitrarily long time, and menstruation may be absent. A striking example of such a violation is hyperprolactinemia, due to increased production of the hormone prolactin by the pituitary gland. Prolactin is responsible for maintaining pregnancy and lactation and is normally elevated only during pregnancy and lactation.
If a woman is pregnant, then menstruation will not occur and the temperature will remain elevated throughout the pregnancy. A decrease in basal temperature during pregnancy may indicate a lack of hormones that maintain pregnancy and the threat of its termination.
With the onset of pregnancy, in most cases, on the 7th - 10th day after ovulation, implantation occurs - the introduction of a fertilized egg into the endometrium (the inner lining of the uterus). In rare cases, early (before 7 days) or late (after 10 days) implantation is observed. Unfortunately, it is impossible to reliably determine the presence of implantation or its absence either on the basis of the schedule or with the help of ultrasound at a gynecologist's appointment. However, there are several signs that may indicate implantation has taken place. All these signs can be detected on the 7-10th day after ovulation:
It is possible that these days there are small discharges that disappear within 1-2 days. This may be the so-called implantation bleeding. At the time of the introduction of the egg into the inner lining of the uterus, the endometrium is damaged, which leads to minor discharge. But if you have regular discharge in the middle of the cycle, and pregnancy does not occur, then you should contact the gynecology center.
A sharp decrease in temperature to the level of the midline for one day in the second phase, the so-called implantation retraction. This is one of the signs most often observed in charts with confirmed pregnancy. This retraction can occur for two reasons. Firstly, the production of the hormone progesterone, which is responsible for raising the temperature, begins to decline from the middle of the second phase, when pregnancy occurs, its production resumes again, which leads to temperature fluctuations. Secondly, during the onset of pregnancy, the hormone estrogen is released, which in turn lowers the temperature. The combination of these two hormonal shifts leads to the appearance of implantation depression on the graph.
Your chart has become triphasic, which means you are seeing an ovulation-like rise in temperature on the chart during the second phase of your cycle. This rise is again due to increased production of the hormone progesterone after implantation.

On the example of the graph - implantation retraction on the 21st day of the cycle and the presence of the third phase, starting from the 26th day of the cycle.
Early signs of pregnancy such as nausea, tightness in the chest, frequent urination, indigestion, or just feeling pregnant also do not give an accurate answer. You may not be pregnant if you have all of these signs, or you may be pregnant without a single symptom.
All these signs can be a confirmation of the onset of pregnancy, but you should not rely on them, since there are many examples in which the signs were present, but the pregnancy did not occur. Or, conversely, with the onset of pregnancy, there were no signs. The most reliable conclusions can be drawn if there is a clear rise in temperature on your chart, you had intercourse 1-2 days before or during ovulation, and your temperature remains high 14 days after ovulation. In this case, the time has come to take a pregnancy test, which will finally confirm your expectations.
Basal temperature measurement is one of the main fertility tracking methods recognized by the World Health Organization (WHO). for details, see the WHO document "Medical Eligibility Criteria for the Use of Contraceptive Methods" page 117.
When using the basal temperature method to prevent unwanted pregnancy, you need to consider that not only the days of ovulation according to the basal temperature schedule can be dangerous. Therefore, in the period from the beginning of menstruation until the evening of the 3rd day after the rise in basal temperature, which occurs after ovulation, it is better to use additional measures to prevent unwanted pregnancy.
Our regular reader, Natalya Gorshkova, has compiled a form for you to quickly fill out and automatically plot a basal temperature chart, which you can print out and show to your doctor. You can download it from the link: schedule form.
Charts are discussed on the forum
Attention! It is impossible to make any diagnoses only on the basis of basal temperature charts. Diagnosis is made on the basis of additional examinations conducted by a gynecologist.
The graph of basal temperature during pregnancy reflects the direct dependence of rectal indicators on the influence of hormones at different periods of the menstrual cycle.
MC has 2 phases.
- Follicular - the first half proceeds under the influence of estrogen. During the period of maturation of the egg, temperature fluctuations are allowed within the range of 36.4–36.8 ° C.
- Luteal - ovulation occurs. That is, the bursting follicle is replaced by the corpus luteum, which synthesizes progesterone. An increase in hormone production provokes an increase in temperature by 0.4–0.8 ° C.
In a normal state (before pregnancy), the basal temperature drops slightly before menstruation. A jump in indicators to a minimum downward is noted before ovulation.
An example of a normal two-phase temperature graph:
normal example
The middle (or overlapping) line serves to make the curve easier to read. It is carried out at the points of six temperature values before ovulation in the follicular phase.
The first 5 days of menstruation, as well as situations in which external factors influenced, are not taken into account. Consider a photo that shows what a finished chart looks like with real temperature readings during pregnancy:

The woman celebrated every day
The curve shows that BBT does not decrease before menstruation. If, against the background of increased rectal temperature, there is a delay in menstruation, then the pregnancy has taken place.
To confirm the findings, it is necessary to conduct a test and come for a consultation with a gynecologist. Be sure to show your temperature chart to your doctor.
Signs of pregnancy and its absence on the BBT chart
At conception, the basal temperature rises. The indicators do not decrease before the onset of menstruation and remain throughout the entire gestation period.
You can determine pregnancy according to the schedule by the temperature jump on the 7-10th day after ovulation - this is the moment the fertilized egg is introduced into the inner lining of the uterus.
Sometimes early or late implantation is observed. Even the most informative ultrasound examination cannot reliably track this process.
A sharp decrease in temperature on the graph in the second phase is called implantation depression. This is one of the first and most frequent signs that is noted on the basal chart with a confirmed pregnancy.
This phenomenon is due to two reasons.
- The increased production of progesterone increases the temperature, which gradually decreases closer to the middle of the luteal phase. At conception, the corpus luteum begins to actively synthesize the hormone, which leads to fluctuations in values.
- If pregnancy occurs, then a large amount of estrogen is released, which causes a sharp decrease in temperature in the scheme.
The connection of hormones with different functions leads to a shift, which manifests itself in the form of an implantation depression on a personal map.
This phenomenon cannot be reflected by any other study other than the basal temperature curve. Example:

Implant retraction
Please note that with a completed pregnancy, starting from the 26th day of the menstrual cycle, the schedule becomes three-phase. This is due to the increased synthesis of progesterone after implantation of the egg.
Confirmation of the introduction of the embryo may be a slight discharge that disappears in 1-2 days. This is implantation bleeding, which is caused by damage to the endometrium.
Nausea, breast swelling, intestinal disorders and other similar signs are not reliable. There are cases when, even with severe manifestations of toxicosis, pregnancy did not occur.
And, on the contrary, without a single sign, the woman stated the fact of a successful conception. Therefore, the most reliable conclusions are considered to be a persistent increase in basal temperature, implantation retraction. Another sign is a delay in menstruation, subject to sexual contact during the period of ovulation.
A decrease in temperature before menstruation is a sign of the absence of pregnancy. Fluctuations in rectal numbers can be interpreted in different ways. Fever is not always a sign of pregnancy. This is possible due to inflammation of the appendages.
Each case must be compared with all the changes in the body and confirm your observations in the gynecologist's office.

It is important to record data regularly
Normal basal temperature chart during pregnancy
Keeping a BT calendar is relevant only at the very beginning, that is, in the early stages of gestation. Favorable conditions are necessary for the normal development of the embryo in the first trimester.
For this, the body of a pregnant woman begins to intensively produce progesterone. This hormone raises the temperature in the reproductive system to create a "warm" environment for the embryo.
Normally, after the onset of egg implantation, the basal temperature figures on the diagram should be in the range of 37.0–37.4 ° C.
However, in some cases, a drop to 36.9 ° or an increase to 38 ° is allowed. Such values may be considered acceptable.
Unusual BT schedules during pregnancy
Normally, the temperature difference between the first and second phases should fluctuate within the allowable 0.4 ° C and above.
How to determine the average BBT? To do this, it is necessary to add up all the temperature numbers obtained during the measurement, first in period I, dividing the sum by the number of days. Then similar calculations are carried out with indicators of phase II.
Let's look at a few examples that are most common.

Anovulatory cycle
This graph shows a uniform curve without division into periods. It can be seen that BT in the luteal phase remains low, not exceeding 37°C.
In the absence of ovulation, the formation of the corpus luteum is impossible, which activates the synthesis of progesterone. There is no upswing.
If the anovulatory cycle is repeated periodically, no more than 1-2 times a year, then this is the norm. However, if the situation occurs in a row for 60 days or several months, then it will be difficult to get pregnant on your own.
Next example:

Need to consult a doctor
With estrogen-progesterone deficiency, the rectal temperature chart remains low after ovulation, up to the 23rd day of the cycle. The difference between the average values is a maximum of 0.2–0.3°.
A similar curve built over several MCs indicates a lack of production of hormones important for the development of pregnancy. The consequence of the pathology may be endocrine infertility or the threat of miscarriage in the early stages.
Next example:

Possibly a disease
Endometritis is an inflammation of the inner lining of the body of the uterus. With this disease, the temperature curve reflects a decrease in indicators before menstruation and a sharp rise in values, uncharacteristic for the first phase.
Next example:

The chart is useless here.
This graph shows high readings up to 37° in the first phase. Then there is a sharp decline, which is often mistaken for an ovulatory rise. With inflammation of the appendages, it is difficult to correctly determine the moment of release of the egg.
By examples, it can be understood that it is easy to identify pathologies using a personal basal map. Of course, twins or one embryo can only be shown by ultrasound, but the conception on the BT map is determined accurately.
Graph of basal temperature for ectopic and missed pregnancy
With anembryony (death of the fetus), elevated rectal values decrease to 36.4–36.9°C. The decrease in temperature on the graph is due to the regression of the corpus luteum and the stoppage of progesterone production.
Low values in the second phase are possible due to a lack of hormones. Sometimes, with a frozen pregnancy, there is a sharp rise in temperature against the background of decomposition of the embryo and inflammation of the endometrium.
Ectopic conception by rectal indicators can not be detected. With ectopic fetal development, progesterone is produced as during normal gestation of the first trimester.
However, against the background of the growth of the embryo, there are symptoms that you should immediately pay attention to. This is an acute pain syndrome in the abdomen, discharge, vomiting, etc.

On the days of ovulation
At the same time, an inflammatory process can develop, which is usually manifested by a sharp rise in temperature to 38 ° and above.
Do not self-diagnose. Any suspicious changes in the rectal temperature chart should be reported to a doctor.
By correctly reading the basal temperature chart during pregnancy, even before the delay in menstruation, the expectant mother can track its onset. You also need to know what factors can distort the result, so as not to take them for deviations in the development of pregnancy.
Characteristic indicators at different stages of the cycle
Basal temperature, as one of the methods for determining a day favorable for conception, is currently widely used, although the measurement does not give a 100% guarantee and has a sufficient number of shortcomings. When planning a pregnancy, you need to start preparing in advance and, for comparison, take readings of at least 3-4 cycles, building a curve connecting daily temperature points.
Before talking about building a digital axis, let's figure out what normal values should be displayed on it:
End of the menstrual cycle
- At the end of menstrual bleeding in the first period of the cyclic process, the thermometer shows approximately 36.2-36.5 ° C. It is at such marks on the thermometer that the maturation of the egg occurs with the participation of estrogen, which controls this process.
Temperature before and after ovulation
- On the eve of ovulation, there is a slight decrease in temperature by a few tenths of a degree, and then an increase to 37 ° C and above. This indicates the release of the cell and its movement to meet the sperm in the fallopian tube.
An example of a basal temperature chart during pregnancy before a delay
- After the fusion of the germ cells, the graph of the basal temperature during pregnancy before the delay (photo examples confirm this), stably shows slight fluctuations between 37 and 37.5 ° C throughout the pregnancy.

- If fertilization has not occurred, a few days before menstruation, a gradual decrease in temperature begins and from the first critical day it becomes 36.8 ° C and lower.
Diagnosis of pregnancy according to the schedule
Elevated temperature marks on the curve are the first indirect sign of an accomplished conception, then it will be confirmed by nausea, pain in the mammary glands, mood changes, taste preferences, etc., and the final line will be put by two identical strips on the test.
Graph of basal temperature during pregnancy before delay - 36.9 ° C
The very moment of fertilization passes unnoticed for the woman, but the implantation of the embryo to the endometrium can be fixed. In this case, the graph of basal temperature during pregnancy before the delay is 36.9 ° C or slightly less on days 5-7 after ovulation. Approximately such a period of time is necessary for the fetal egg to reach the uterus and begin to penetrate into its wall.

At this point, slight pulling pains in the lower abdomen may be felt, and there may be slight bloody discharge from the vagina, as a symptom of fetal attachment. The decrease will be visible for only a day, and then the curve will return to the values that were before the sinking and will no longer deviate.
Signs that distort indicators
We examined the normal course of pregnancy in the early stages and its inherent adequate values. But sometimes the schedule of basal temperature during pregnancy before the delay, examples have deviations, both upward and downward temperature values. They are caused by certain reasons related to the influence of internal and external factors on the woman's body.
When the shift in indicators happens once, it can be attributed to errors in temperature measurement that occurred due to a completely understandable reason:
- Insomnia;
- Short-term sleep, less than 6 hours;
- Cold;
- Sexual intercourse 3-4 hours before measurement;
- Excessive physical activity the day before;
- Stress.

Dangerous sinking in the basal temperature chart during pregnancy
Ectopic pregnancy
If an increase of 37.5-38 ° C is observed and lasts for several days, an inflammatory process in the female reproductive system can be suspected. It can be an infectious disease, and possibly an ectopic pregnancy. Attaching a fetal egg in the wrong place can cause a peculiar reaction with temperature jumps up and down and the curve turns out to be somewhat wrong with atypical sinking.
Missed pregnancy or miscarriage
Decreasing rates below 36.9°C with confidence in conception is also a cause for concern. In this case, a frozen pregnancy or a threatened miscarriage is suspected. This state of temperature values \u200b\u200bis explained by a decrease in the level of progesterone, which occurs due to the death of the fetus. It is no longer necessary to support the development of the embryo, the corpus luteum gradually reduces its production, the hormone content in the blood drops. He is no longer able to maintain elevated basal temperature numbers, and it drops.
 If a threatened miscarriage is suspected, the temperature will be below 36.9 ° C on the chart during pregnancy until the delay.
 Chart of basal temperature during pregnancy before delay (video)
In this video, an obstetrician-gynecologist talks about how to correctly measure basal temperature during pregnancy before a delay.
To make sure that you are correctly scheduling your basal temperature during pregnancy before a delay, video materials and examples of girls on the forums will help get rid of doubts about the sequence of actions and deal with temperature values.
Conclusion
When compiling the temperature curve, one should not forget that for each organism only its inherent values \u200b\u200bare characteristic, therefore it is not the numbers themselves that are important, but rather the difference between the first and second phases of the cycle, which should be at least 0.4 ° C.
One of the most widely used pregnancy planning methods is basal temperature charting, which can help a woman choose the best day to conceive. In this article, we will introduce you to some basal temperature charts with examples and transcripts.
The basal temperature differs from the usual one in that it is measured:
- rectally
- only in the morning hours
- in a state of complete rest
Her indicators can determine the state of the hormonal background of a woman in order to conceive a child.
The fact is that during the release of the egg from the bursting follicle, the corpus luteum, which is formed on the ovary, begins to produce progesterone, a hormone that speeds up all processes in the body, and also increases the basal temperature. As soon as a woman notices a sharp jump on her chart, this means that ovulation has come and you can try to get pregnant.
Doctors say that sometimes an increase in basal temperature does not indicate ovulation, but luteinization of the follicle - a situation where it does not burst, but a corpus luteum that produces progesterone still forms on it. If the basal temperature during the menstrual cycle is stable all the time, most likely, this means that there was no ovulation.
It happens that the basal temperature chart in one cycle consists exclusively of high indicators. This means that a woman progresses a disease such as hyperprolactinemia, in which the content of prolactin in the blood increases.

How to measure basal temperature?
To achieve accurate results, you need to measure the temperature of several menstrual cycles in a row. As a rule, 3-4 cycles can already show the full picture.
Now we will tell you in detail how to take measurements of basal temperature:
- Choose one thermometer (mercury is best) that will measure your basal temperature only. This is important not only to ensure that all hygiene standards are observed, but also in order to obtain accurate indicators.
- Before inserting the thermometer into the anus, it can be lightly lubricated with petroleum jelly so that the skin of the anus is not injured.
- It is recommended to take measurements:
- After six hours of uninterrupted sleep
- Every time at the same morning time
- within 7 minutes
- Lying down

- You can not stop measuring basal temperature even during menstruation.
- Get a separate notebook or notebook where you can write down the results of daily measurements and build basal cycle temperature chart. The following parameters must be specified in the chart:
- Date and exact time at which the measurement was taken
- Day according to the menstrual cycle (it is desirable to measure the basal temperature from the first day)
- Notes (you can enter here, which may affect the accuracy of the indicators)
What about women who, due to night work, cannot measure basal temperature in the morning? In such cases, you can do this during the day, but always after a six-hour sleep.
Important! In some sources, you can come across information that basal temperature should be measured not only through the anus, but also through the vagina and in the mouth. These facts cannot be denied, however, as practice shows, the most reliable indicators are obtained if the traditional method is followed.

The main thing here is to choose one method from the existing ones, and always measure the basal temperature only in the same place. If you alternate them, then the drawn up schedule will have no value. By the way, we list a few points at which measurement indicators may be inaccurate:
- If a woman has had a disease in which the body temperature always rises (this can be a common cold or SARS)
- If a lady takes medications (especially hormonal drugs)
- If the temperature is taken after a party where a lot of alcohol was drunk
- If a woman has a too intense rhythm of life (had to be on flights and trips)
Examples of basal temperature charts with photos and transcripts
So that you can figure out how to make babyplane basal body temperature chart, we offer you some specific examples that will teach you to independently determine the day of ovulation without acquiring special tests and ultrasound diagnostics.

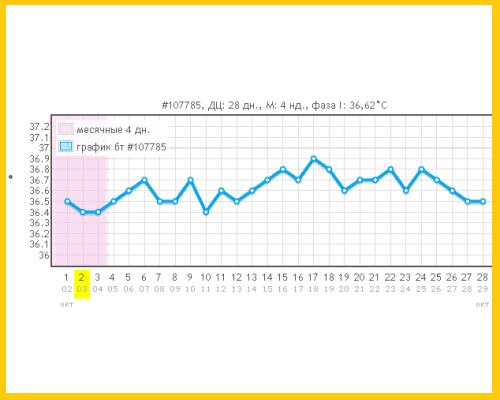
Basal temperature chart before menstruation
To begin with, we propose to consider a graph of the basal temperature of the menstrual cycle, in which pregnancy was not planned, in order to understand how the indicators will change in the second phase of the cycle after ovulation immediately before menstruation:

On this chart:
- The red line indicates the division of the entire menstrual cycle, consisting of 28 days, into two phases - folliculin (shown on the left) and luteal (shown on the right). This is how it should look normal basal temperature chart in a healthy woman who did not plan to become pregnant.
- Considering the luteal phase - the period in which the next menstruation is brewing, we see that the basal temperature a couple of days before their onset begins to decrease from 37.5 to 37. That is, it should coincide with the temperature of the day on which the previous menstruation began menstruation (on the graph, this is evidenced by the pink line).
- During the entire period, while menstruation lasts, the basal temperature should be the same.
Anovulatory basal temperature chart
Anovulatory is the menstrual cycle in which ovulation does not occur, that is, fertilization cannot occur, because a mature egg has not come out of the ovarian follicle. This is how it is shown on the basal temperature chart:
It shows that:
- The temperature did not rise above 36.9 degrees (did not reach the pink line drawn on the chart). During ovulation, this indicator should be equal to 37.1 degrees.
- The graph is monophasic - there is no red line indicating the release of a mature egg.
Normally, a healthy woman can have only two such cycles per year. If you find that you have more of them, this is an occasion to contact fertility doctors who will solve your problem with the inability to conceive a child.
Ovulation basal temperature chart
How to find the day of ovulation on the chart? Consider this question using the example of such a basal temperature chart:

It clearly shows that:
- On the 13th day of the menstrual cycle, the basal temperature increased sharply, and on the 14th day it dropped sharply from 36.2 to 37.1
- When this happens, it means that ovulation was, and the most favorable time has come to conceive a child.
Incidentally, one can define on the graph of basal temperature, implantation retraction- the day when the fertilized egg is attached to the wall of the uterus:

- On the day when implantation retraction occurs, the basal temperature drops sharply from 37 degrees to 37.7;
- The next day we see basal temperature chart during pregnancy before delay that the temperature began to rise again - it had already reached 36.9 degrees;
- In the following days for chart basal temperature before delay only grows.
Basal temperature chart during pregnancy
If pregnancy occurs, then the corpus luteum will be on the ovary for 9 months, which should produce progesterone. And this means that the entire period of bearing a child, the basal temperature will be 37.1-37.3 degrees, as shown in the graph below:

We hope that now you will be able to accurately decipher basal temperature charts to become a happy pregnant woman in the near future.
Video: “Basal temperature measurement. Pregnancy planning»
What does the internal temperature curve indicate?
Pregnant women conduct charts of basal temperature, focusing mainly on obstetric terms, which are calculated from the beginning of the cycle, so they are 2 weeks longer than embryonic terms.
According to the schedule, it is possible to trace whether there was ovulation and to suggest possible fertilization, if in the second phase the temperature rises or stably keeps at a high level (from 37 ° C) for at least 14-18 days.
Many pregnant women note on their chart of basal temperature during pregnancy before the delay a one-day decrease in internal temperature on the 7th - 10th day from ovulation (implantation retraction). This moment is associated with the attachment of the embryo to the uterus and the hormonal changes occurring in the body. Often, at the time of fixation of the fetal egg, slight bleeding is observed for 1-2 days, pulling pains in the lower abdomen. Then, during the normal course of pregnancy, BT should consistently exceed 37 ° C. It can also rise slightly by 2-3 tenths of a degree on the day of the delay (but not for everyone).
Norm
Examples of graphs of basal temperature in pregnant women who have successfully carried and given birth to a child may differ slightly in numerical values, but a pattern can be traced in them: BBT in the second phase of the monthly cycle should be at least 0.4 - 0.5 ° C higher than in the first . In some women, the internal temperature in the first phase can be stably low (for example, 36.2 ° C), then it is not scary if after ovulation it does not rise above 37 degrees. Sometimes, even after fertilization, as well as in the process of gestation, BT does not rise above 39 ° C, and women endure pregnancy without complications.
According to the basal temperature chart during pregnancy, the norm after ovulation and conception is 37.1-37.4 ° C. This is exactly what ideal BT happens when the fetal egg is fixed in the uterus and progesterone and chorionic gonadotropin begin to be intensively secreted, the content of which in the body determines the onset of pregnancy.
The upper temperature limit is 38°C, the lower one is 37 - 36.9°C. If BBT in pregnant women, especially in the first weeks, decreases or increases significantly, these temperature jumps can pose a threat to gestation. At the same time, a one-day temperature jump still does not mean anything, since it may be the result of simply incorrect measurement or other factors.
The so-called "pregnant" graphs of basal temperature on the forums are presented in various variations with different cycle lengths and average temperatures. Women share not only their schedules, but also their feelings during each period of gestation, as well as comments on them.
The normal graph of internal temperature after fertilization, starting from the 3rd week, should differ from the usual two-phase graphs, when conception does not occur and menstruation begins.
In pregnant women, there should be no premenstrual temperature drop if progesterone levels are normal.
Their "pregnant" graph visually resembles a monotonous straight line with a temperature of 37 ° C and above.
Deviations
More often than others, a pregnant BT schedule with a low temperature is found. In various forums, women express their concerns and ask for advice regarding low internal temperatures during gestation. If you go to such a forum, the schedule of basal temperature during pregnancy for many women who have given birth may differ from normal. Benchmarks. But this is not necessarily a sign of violations. In principle, BT in pregnant women is always increased, because after conception the corpus luteum does not resolve, but continues to contribute to the production of progesterone until the placenta is fully formed, and this occurs up to 12-16 weeks.
Recall that after 12-16 weeks, the BBT measurement data is far from being so informative, since during this period, the placenta, rather than the corpus luteum, is responsible for the production of hormones. Therefore, if you find that after the 14th - 16th week, the basal temperature drops, this can be explained by hormonal changes and you should not panic.
 The internal temperature during gestation can be compared with the level of the normal second phase or slightly higher. The norm for each woman is individual, it may not reach the required minimum - 37 ° C. Or it could be very high. Thus, in 25% of pregnant women, BBT is 38°C.
But in most cases, an abnormal basal temperature chart during pregnancy is a cause for concern and a possible sign of pathologies. This is especially true for women who already had problems with bearing (early involuntary abortions, miscarriage). Consider possible deviations from the schedule and their causes.
Types and causes of deviations
Examples of basal temperature charts during pregnancy with deviations in the direction of increasing or decreasing BBT are associated with the following groups of reasons.
- A decrease in internal temperature to 36.8 ° C and below is often associated with a lack of hormones necessary for normal gestation (especially progesterone). In such cases, the risk of fading the development of the fetus or involuntary abortion (miscarriage) increases. Often in such cases, when there is a threat of termination of pregnancy, the woman has pain and pulls in the lower abdomen, spotting is observed.
- High BBT is not as dangerous as low BBT. But it cannot be ignored, since a long-term rise in indicators to 37.9 - 38 ° C can be interpreted in different ways:
- as a sign of any inflammation;
- as a symptom of attachment of the fetal egg outside the uterus: sometimes an elevated internal temperature during gestation is associated precisely with the threat of an ectopic pregnancy, especially if acute pain in the lower abdomen is superimposed on alarming measurement data.
In any case, overestimated indicators of internal temperature, fixed constantly, can prevent the normal development of the fetus.
It was said above that the temperature marks on your “pregnant” chart must be compared with the BT indicators in the post-ovulation phase during previous cycles. For example, if for a woman the norm in the second phase is 37 ° C, and during gestation this figure jumped to 38 ° C, then this is a serious reason to contact a gynecologist (provided that all measurements were taken correctly). It is possible that a temperature that is very high compared to the individual norm indicates an inflammatory process of a local or general nature.
There are such examples of basal temperature charts during pregnancy on the expectant mothers forum.
If even before conception, a woman had a consistently high temperature in the second half of the cycle, not associated with any disease, then it is hardly worth worrying.
Diagnosis and treatment
If you find the slightest deviations in the schedule from the norm or a strong difference from the individual indicators in the 2nd phase of the cycle, just in case, show your records to the doctor. You may have to take tests, do a pelvic ultrasound and undergo other examinations.
If low temperature during pregnancy is associated with a lack of hormones, timely treatment with synthetic replacement drugs can help save the baby.
With a frozen pregnancy, it will not be possible to normalize the further development of the fetus. In this case, drug therapy will not help - you will have to do scraping. But such a diagnosis must be verified by ultrasound.
Thus, the graph of internal temperature during pregnancy (after conception and implantation retraction) should look like a more or less straight line with indicators of 37 ° C and above. If the graph is zigzag, with temperature jumps, you may simply be violating the rules for measuring temperature. Stably underestimated or overestimated indicators are a reason to see a doctor. Especially dangerous during pregnancy are low temperatures (below 36.8 ° C) and a prolonged increase in BBT over 38 ° C against the background of other symptoms.